Data Cleaning Strategic
data government
data cleansing
A small guidance for data team to find the right data cleaning strategy 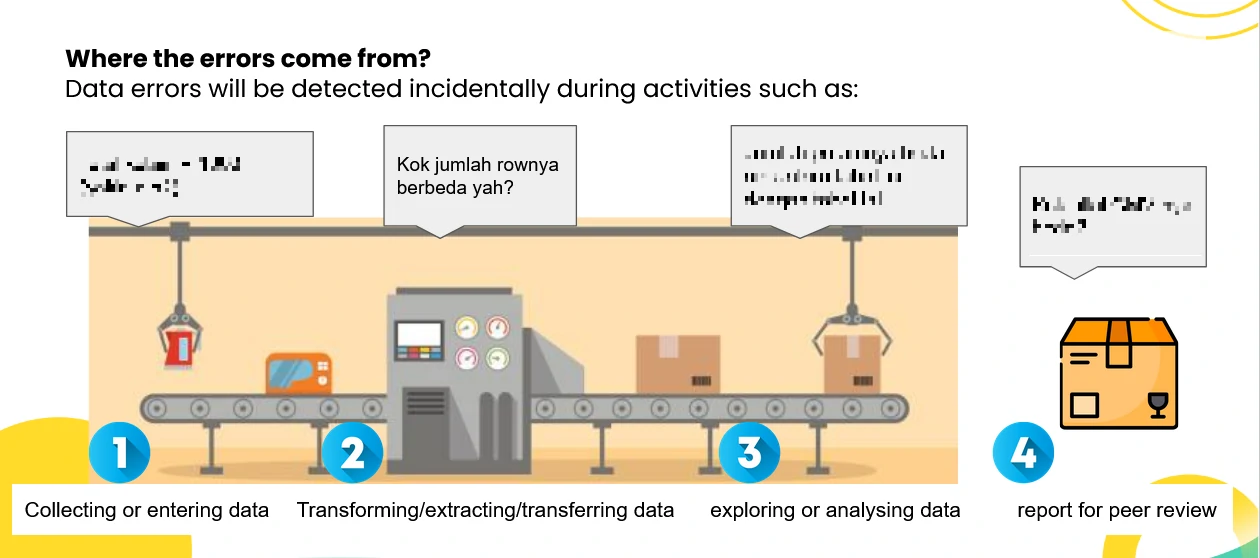
Introduction
What data cleaning is?
Used mainly when dealing with data stored in database, the terms data validation, data cleaning, or data scrubbing refers to the process of detecting, correcting, replacing, modifying or removing messy data from a record set, table, or database.
Why we need data cleaning process?
First of all, Data is dirty. Live with it. Data cleaning consists primarily in implementing error prevention strategies before they occur. However, error-prevention strategies can reduce but not eliminate common errors.
Even with the best error prevention strategies in place, there will still be a need for actively and systematically searching for, detecting and remedying errors/problems in a planned way to find pattern of error. As patterns of errors are identified, data collection and entry procedures should be adapted to correct those patterns and reduce future errors. In analytic and modeling perspective, there are some main guidelines that need to be fulfilled such as: Quality data beats fancy algorithms, or Garbage in, garbage out. A simple algorithm can outweigh a complex one just because it was given enough and high-quality data. It improves data quality and ensures reliable analysis and decisions.
Where the errors come from?
Common Data Issues
- Missing Values
- Duplicates
- Inconsistent Formats
- Outliers
- Invalid data
- Irrelevant data
Sources of Error
Many of the sources of error in databases fall into one or more of the following categories:
- Measurement errors - Data is generally intended to measure some physical process, subjects or objects, that can have systematic or random errors in their design and execution.
- Data entry error - “Data entry” is the process of transferring information from the medium that records the response (traditionally responses written on printed questionnaires) to a computer application.
- Erroneous entry happens as mistyped.
- Extraneous entry add correct, but unwanted information.
- Incorrectly derived value occurs when a function was incorrectly calculated for a derived field.
- Misspelling entry
- Entry into wrong field
- Inconsistencies across tables or files occur
- Processing errors - Raw data are preprocessed before they are entered into a database. i.e. to reduce the complexity or noise in the raw data, to aggregate the data at a higher level, and in some cases simply to reduce the volume of data being stored. All these processes have the potential to produce errors.
- Data integration errors - Any procedure that integrates data from multiple sources can lead to errors. The merging of two or more databases will both identify errors (where there are differences between the two databases) and create new errors (i.e. duplicate records).
How we implement data cleaning process?
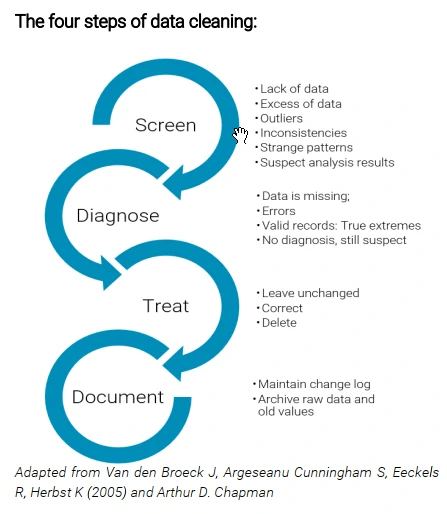
We can use the four steps of data cleaning: Data cleaning involves repeated cycles of screening, diagnosing, treatment and documentation of this process.
- Screening involves systematically looking for suspect features in databases, data source, or analysis datasets.
- Diagnosis (identifying the nature of the defective data).
- Treatment (deleting, editing or leaving the data as it is) phases of data cleaning requires an in depth understanding of all types and sources of errors possible during data collection and entry processes.
- Documenting changes entails leaving an audit trail of errors detected, alterations, additions and error checking and will allow a return to the original value if required.
What we have to do first?
- The first thing to do is to make a copy of the original data or Backup data.
- Try to understand when and how errors are produced during the data collection and workflow.
- Resources for data cleaning are limited. Prioritization of errors related to population numbers, geographic location, affected groups and date are particularly important because they contaminate derived variables and the final analysis.
- Data cleaning should focus on those errors that are beyond small technical variations and that produce a major shift within or beyond the analysis. (in another word, clean a big and impactful error first).
Screening Data
Examine data for the following possible errors:
- Spelling and formatting irregularities - Are categorical variables written incorrectly? Is the date format consistent? For numeric fields are all of the values numbers? Etc.
- Lack of data - Do some categories have far fewer lists compared to others?
- Excess of data - Are there duplicate entries or more answers than originally allowed?
- Outliers/inconsistencies - Are there values that are so far beyond the typical distribution that they seem potentially erroneous?
- Remarkable patterns - Are there patterns that suggest that the enumerator has not answered or recorded data honestly? (i.e. several data unit with the exact same answers or same error)?
- Suspect analysis results - Do the values seem counterintuitive or extremely unlikely?
Common mistakes in examples:
- Misspelling of place names, particularly when translating between different alphabets.
- Use of inconsistent date formats.
- Totals differ from the results of dis-aggregate questions (e.g. total number of household members is not matching the aggregation of a different question where respondents are asked to list household members by age and gender).
- Values are outside of the acceptable range for values for that question, including negative values in fields that can only have positive values (e.g. price of bread).
- Unclear cause of missing data.
- Merging of datasets with different units of measurement (e.g. different interpretations of the term household) or administrative boundaries.
- In case of multiple choice questions: selecting ‘other, please specify’ for a variable that is one of the multiple choice options. (free text input field).
- Malfunctioning skip patterns.
- Overall lack of consistency within the answers provided by a respondent (e.g. the response to questions on main needs is not in line with sector specific questions).
How we detect those errors?
we can implement screening methods, from simpler to more complex, are:
- Screening of columns after sorting
- Use summary statistics
- Validated and/or double data entry
- Printouts of variables not passing range checks and of records not passing consistency checks
- Frequency distributions and cross-tabulations.
- Graphical exploration of distributions: box plots, histograms, and scatter plots using visual analysis
- Plots of repeated measurements on the same individual, i.e., growth curves
- Checking of data using fixed algorithms
- Statistical outlier detection
- In many, if not most instances, data can only be cleaned effectively with some human involvement. Know (and/or train data cleaners) common mistakes and what errors to look for.
- Exploratory data analysis and data visualization are two main ways to detect data errors.
- Different types of errors call for different detection approaches – a spell check will recognize misspelled categorical variables while statistical outlier detection helps identification of extreme values.
Diagnosing Data
What diagnosing data mean?
finding the cause for the errors.
There are a multitude of possible diagnoses for each suspected data point:
- Missing data: Answers omitted by the respondent (nonresponse), questions skipped by the enumerator or dropout.
- Errors: Typos or answers that indicate the question was misunderstood.
- True extreme: An answer that seems high but can be justified by other answers (i.e. the respondent working 60 hours a week because they work a fulltime job and a part-time job)
- True normal: A valid record.
- No diagnosis, still suspect: Make a judgment call on how to treat this data during the treatment phase.
Some data values are clearly logically or biologically impossible. Pre-defined cut-off points immediately help to detect this type of error. Sometimes the suspected value falls within the acceptable range and the diagnosis is less straightforward.
apply a combination of diagnostic procedures, such as:
- Go back to previous stages of the data flow to see whether a value is consistently the same. This requires access to well-archived and documented data with justifications for any changes made at any stage.
- Look for information that could confirm the true extreme status of an outlying data point. This type of procedure requires insight into the coherence of the variables. This insight is usually available from experience or lessons learnt and can be used to plan and program data cleaning.
- Collect additional information. i.e., question the enumerator about what may have happened and, if possible or necessary, repeat the measurement. Such procedures can only happen if data cleaning starts soon after data collection.
The diagnostic phase is labour intensive and the budgetary, logistical, time and personnel requirements are typically underestimated or even neglected at the design stage.
Treatment of Data
what to do with problematic data:
- Leave it unchanged: The most conservative course of action is to accept the data as a valid response and make no change to it.
- Correct the data: If the data original intent can be determined, correct the answer.
- Delete the data? The data seems illogical and the value is so far from the norm that it will affect descriptive or inferential statistics. What to do? Delete just this response or delete the entire record? Remember that whenever data is deleted, there is a risk of consciously or subconsciously “cherry picking” the data to obtain the preferred results. To understand the impact of deleting a data point, a binary variable can be created (1=suspicious record, 0=not suspicious). This new variable can be used as a record filter in Pivot tables or in-table filtering to understand the impact of potentially erroneous data in the final results.
- If time and resources allow, re-measure the suspect or erroneous values.
There are some general rules to support a decision on how to treat the data:
-
If the person undertaking data entry has entered values different from the ones in the real condition, the value should be changed to what was in the real one.
- Type conversion and Standardize - Make sure numbers are stored as numerical data types. A date should be stored as a date object, or a Unix timestamp (number of seconds), and so on. Categorical values can be converted into and from numbers if needed. i.e. Our duty is to not only recognize the typos but also put each value in the same standardized format.
- For strings, make sure all values are either in lower or upper case.
- For numerical values, make sure all values have a certain measurement unit.
- Syntax errors
- Remove white spaces: Extra white spaces at the beginning or the end of a string should be removed.
- Pad strings: Strings can be padded with spaces or other characters to a certain width.
- Fix typos: Strings can be entered in many different ways, and no wonder, can have mistakes.
- The first solution is to manually map each value to either “male” or “female”.
- The second solution is to use pattern match.
- The third solution is to use fuzzy matching: An algorithm that identifies the distance between the expected string(s) and each of the given one.
Missing Values
Given the fact the missing values are unavoidable leaves us with the question of what to do when we encounter them. Missing values are not “unknown”.
The default option for dealing with missing values is to filter and exclude these values from analysis:
- Drop
- Listwise / casewise deletion: All cases that have missing values are excluded. The disadvantage is the loss of data that occurs as all data is removed for a single case, even if some questions were answered.
- Pairwise deletion: Unlike listwise deletion which removes cases that have missing values on any of the variables under analysis, pairwise deletion only removes the specific missing values from the analysis (not the entire case). In other words, all available data is included. In this case, pairwise deletion will result in different sample sizes for each variable.
- Impute - It means to calculate the missing value based on other observations.
- Using statistical values or using a linear regression
- Using Hot-deck or take the random approach
- using 𝑘 nearest neighbour imputation, etc.
- Flag - Set up a dummy variable with value 0 for those who answered the question and value 1 for those who did not. Use this variable to show the impact of different methods.
There are some general rules to support a decision on how to treat the data:
-
Outliers, They are values that are significantly different from all other observations. Outliers are innocent until proven guilty. With that being said, they should not be removed unless there is a good reason for that.
- When variable values do not make sense, if there is no data entry error, and there are no notes to help determine where the error comes from, leave the data as it is. By changing the value into a more reasonable result, significant bias is introduced and there is no justification for changing it. The case should be listed as an outlier (i.e. by using conditional formatting for instance).
- Impossible values are never left unchanged, but should be corrected if a correct value can be found, otherwise they should be deleted.
- With true extreme values and values that are still suspect after the diagnostic phase, we should examine the influence of such data points, individually and as a group, on analysis results before deciding whether or not to leave the data unchanged.
- To limit the impact of outliers and extreme values we can decide to present the median. This is acceptable as long as clearly explained within the findings.
- Some authors have recommended that true extreme values should always stay in the analysis. In practice, many exceptions are made to that rule. We can grouping those values as “excluded from analysis”.
Evaluate and improve the data quality:
- How the data is collected, and under what conditions? The environment where the data was collected does matter. The environment includes, but not limited to, the location, timing, weather conditions, etc.
- What does the data represent? Does it include everyone? Only the people in the city?. Or, perhaps, only those who opted to answer because they had a strong opinion about the topic.
- What are the methods used to clean the data and why? Different methods can be better in different situations or with different data types.
- Do you invest the time and money in improving the process? Investing in people and the process is as critical as investing in the technology.
Documenting Changes
Documentation of error, alterations, additions and error checking is essential to:
- Maintain data quality
- Avoid duplication of error checking by different data cleaners.
- Recover data cleaning errors.
- Determine the fitness of the data for use.
- Inform users who may have used the data knowing what changes have been made since they last accessed the data.
Create a change log within the workbook, where all information related to modified fields is sourced. This will serve as an audit trail showing any modifications, and will allow a return to the original value if required. Make sure to document what data cleaning steps and procedures were implemented or followed, by whom, how many users were affected and for which data.
Within the change log, store the following information:
- Table (if multiple tables are implemented)
- Column, Row
- Date changed
- Changed by
- Old value
- New value
- Comments
Adapt Process
Once errors have been identified, diagnosed, treated and documented and if data collection/entry is still ongoing, the person in charge of data cleaning should give instructions to enumerators or data entry operators to prevent further mistakes, especially if they are identified as non-random.
Feedback will ensure common errors are not repeated and will improve the assessment validity and the precision of outcomes.
Main recommendations or corrections can include:
- Programming of data capture, data transformations, and data extractions may need revision.
- Corrections of questions in the data input form.
- Amendment of the assessment protocol, design, timing, enumerators training, data collection, and quality control procedures.
- In extreme cases, it may be necessary to reconduct some field assessment (few sites) or contact again enumerators to ask additional information or more details or confirm some records.
Data cleaning often leads to insight into the nature and severity of error-generating processes or in some cases, it leads to fraud detection.
Clean data isn’t glamorous, but it’s the foundation of every greate insight. Take the time, it pay off.